Sorghum is an extremely important cereal crop that is likely to become more critical as the world’s population increases. By 2050, feeding the global population will necessitate a 70% increase in agricultural production. Sorghum, already a staple in parts of Asia and Africa, is stress tolerant and could be an important part of a larger plan to meet the increased need. RNA sequencing (RNA seq) is the ‘go to’ method for high throughput processing of gene expression profiles. Gene co-expression networks (GCNs) can be used with RNA seq in researching gene functions and regulatory mechanisms. GCNs, which have been constructed for crops -such as rice, maize, wheat, and soybean- allow simultaneous identification and classification of many genes with similar expression characteristics. GCNs for sorghum are either non-existent or based on outdated data. The gene functions and regulatory mechanisms that GCNs could help study is of fundamental importance in increasing nutrients and yield and is of great interest to scientists, breeders and growers.
In an effort to develop global GCNs for sorghum, as well as barley, researchers at Ohio University downloaded RNA-seq data for barley and sorghum from the NCBI SRA database. The researchers found 774 datasets for sorghum and 500 for barley. The data was categorized according to tissue type (leaf, seed, shoot and root) and study type (biotic treatment, abiotic treatment, developmental and genotype comparison). The researchers not only developed global GCNs, but also used these classifications to develop tissue-specific GCNs.
The GCNs were obtained through a computational process that began with using the Pearson Correlation Coefficient (PCC) to calculate each gene pair’s co-expression score. The PCC calculations were repeated 1,000 times using eighty percent randomly selected datasets for each repeat, and were averaged to generate the final PCC matrix. MR, a co-expression ranking method used in many co-expression databases, was applied to the data. The results were entered into a database, PlantNexus, which organizes information on gene expression across the dataset and provides access to information like the percentage of data sets in which a gene is expressed and tissue level expression and co-expression scores.
The strengths of the PlantNexus platform include a large number of consistently processed RNA-seq data sets, global and tissue-specific GCNs, and a centralized web interface with interactive visualizations for easy navigation of GCNs and expression levels.
The authors plan to update PlantNexus annually or when a large amount of new data is available and to add new features in response to user feedback. They are hoping that it will become a valuable resource for those in the sorghum and barley research communities.
In the words of Dr. Michael Held, senior author of the study, associate professor and on-campus graduate recruitment chair at Ohio University: “Gene co-expression network (GCN) analysis is a powerful genomic approach for inferring gene function within tissues, across development, and in response to stress. Few GCN resources exist for understudied crops like sorghum. PlantNexus was developed to fill that gap for two major cereal crops, barley and sorghum.”
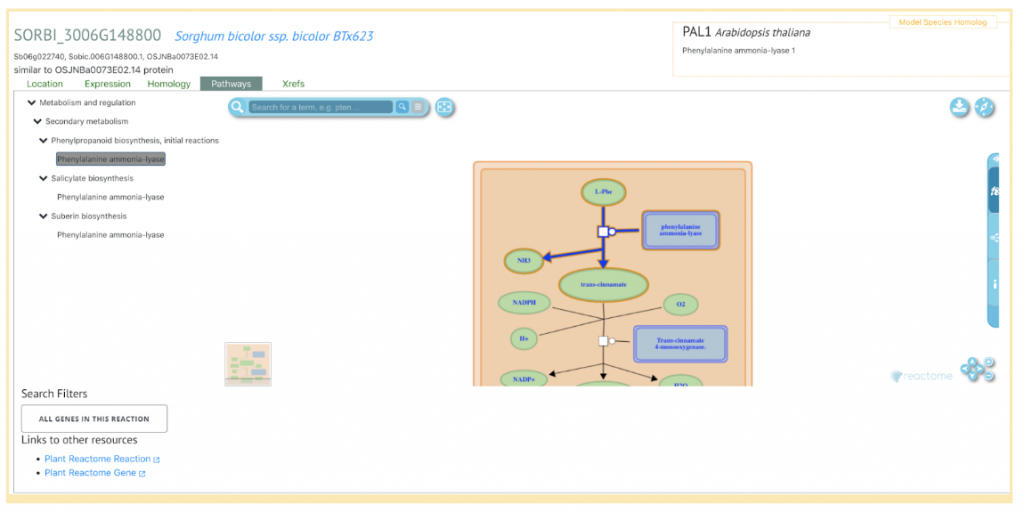
SorghumBase Example

Zhou Y, Sukul A, Mishler-Elmore JW, Faik A, Held MA. PlantNexus: A Gene Co-expression Network Database and Visualization Tool for Barley and Sorghum. Plant Cell Physiol. 2022 Apr 19;63(4):565-572. PMID: 35024864. DOI: 10.1093/pcp/pcac007. Read more
Related Project Websites:
PlantNexus: https://plantnexus.ohio.edu/
Ohio University: https://www.ohio.edu/cas/held